
Premium Report - Sell Through Reports
Sell Through Rate (By Product, By Variant, By Vendor)
Sell Through Reports are used to compare how much of something has been sold vs how much you have in stock.
These reports all follow a very similar format - tracking your Sell Through Rate on a per-product, per-variant or
per-vendor basis.
As Premium Reports, these are available on all Paid Plans of Report Toaster. If you aren't signed up, follow these steps here to upgrade your account.
Here are a few terms to be familiar with in order to understand Sell Through Reports:
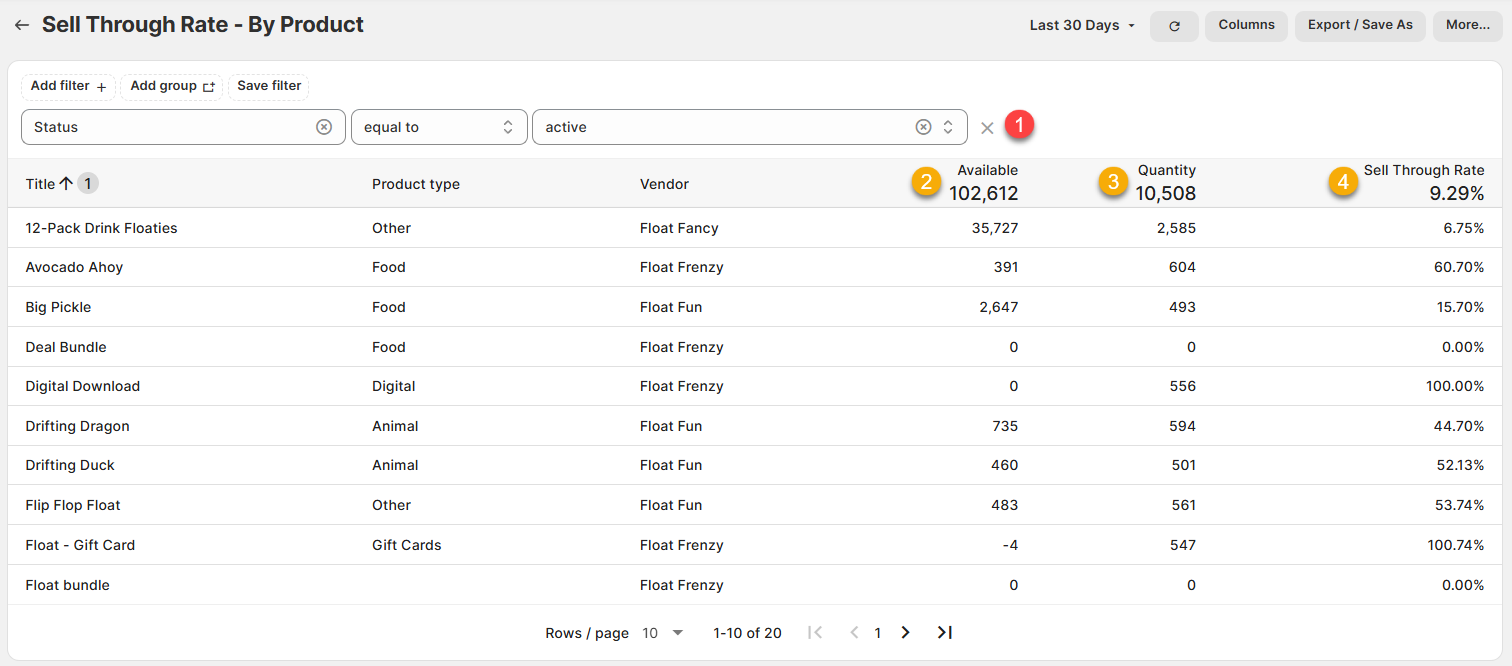
1.) Status, equal to, Active (FILTER): This filter ensures that only currently active products
display in the report.
This prevents lots of draft products with 0 sales and 0 available from showing in the report.
2.) Inventory available: The quantity of units you currently have in stock for a particular
product/variant/vendor.
For example, I have 391 units of the Avocado Ahoy product currently in stock in my warehouse.
3.) Quantity: The units sold for a particular product/variant/vendor. This number does NOT factor in
Returns (for that, replace the column with Net Quantity instead).
For example, I sold 604 units of the Avocado Ahoy product
4.) Sell Through Rate: The Sell Through Rate (STR) for a particular product/variant/vendor. This is
worked out as a percentage by taking the Quantity Sold divided by (Inventory available + Quantity Sold)
x100
For example, if I sold 604 units of the Avocado Ahoy product and still have 391 units in stock, then the calculation would be 604 / (391+604) x 100 = 60.70%
Like all Report Toaster reports, these reports are fully customizable - so you can adjust the date range, add/remove
columns, introduce a filter or change the sort to suit your individual needs. See our basic guides here for
more info.
For other premium reports you can be added to your account, check out our main guide here.